The customer chose to protect their confidential information
An Oil Well Monitoring Solution

About the Client
In this case, the customer was a provider of 3D visualization software. Based in North America, the business actively works in the Oil & Gas sector.
![[object Object] on the map](https://static.andersenlab.com/andersenlab/new-andersensite/bg-for-blocks/about-the-client/canada-desktop-2x.png)
About the project
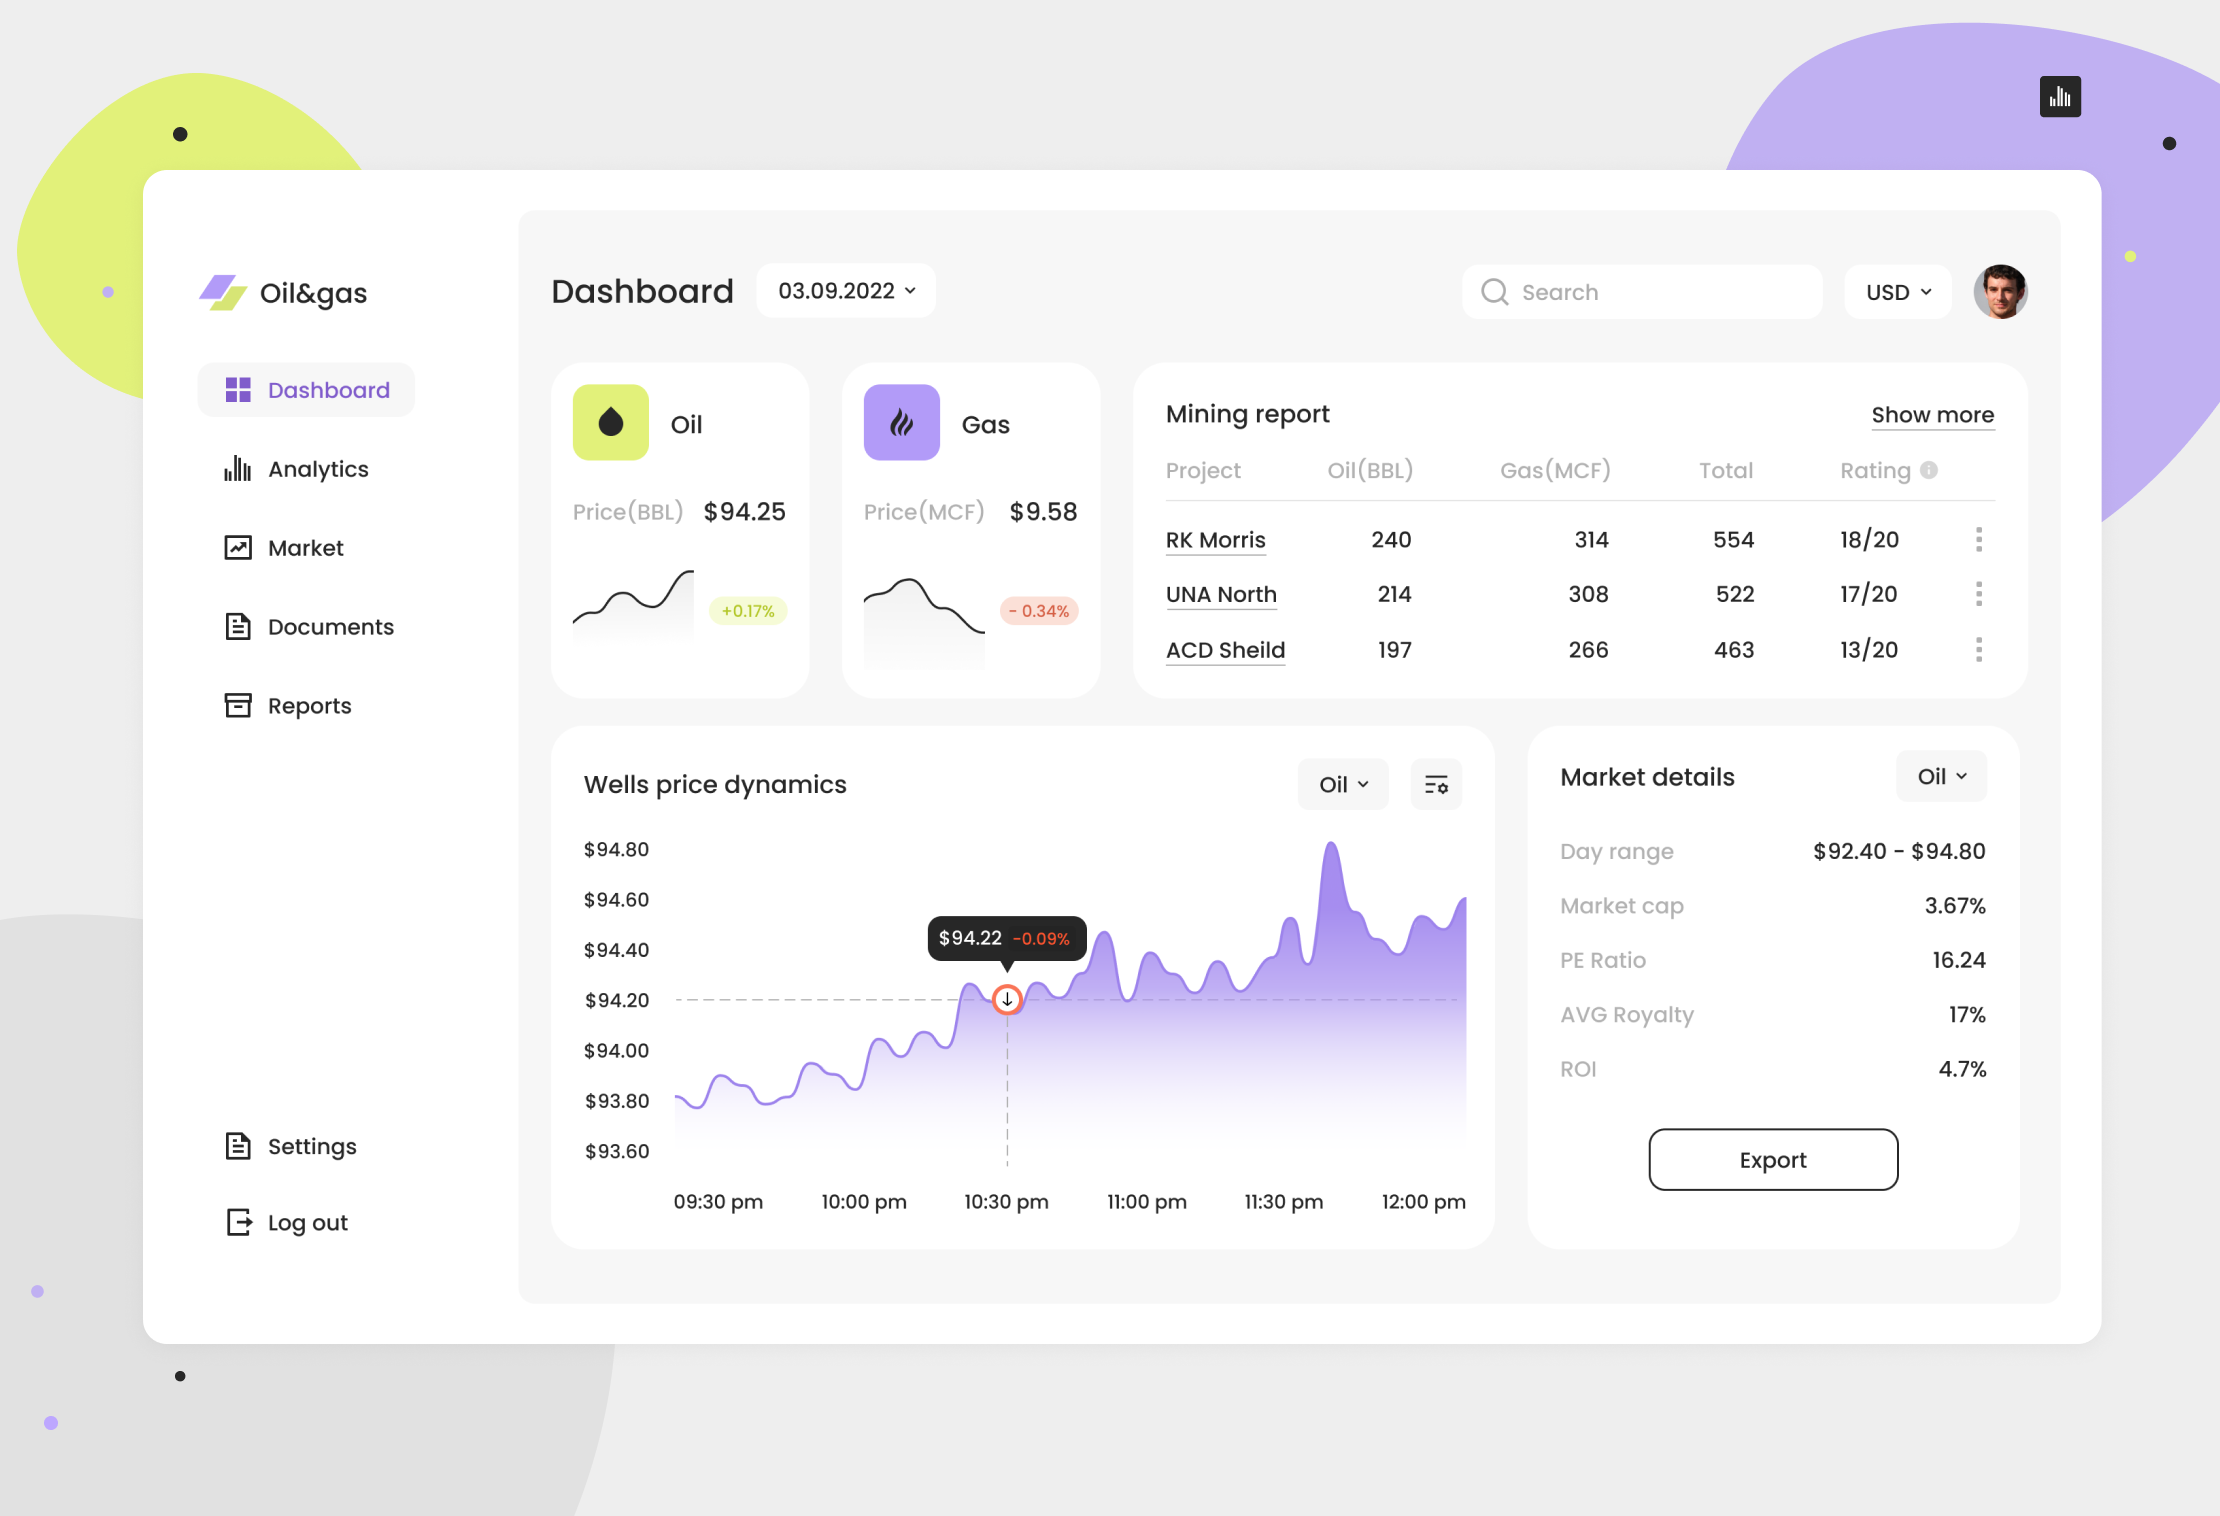
Andersen was approached by a Canadian supplier of 3D visualization software for the Oil and Gas sector. Their request was to create a cloud-based oil and gas reporting system that would allow construction, oil and gas, mining, and other industrial companies to improve their daily operations and project execution. The aim was to build a fully digital system capturing and recording events on-site, organizing and automating data flows, and displaying workflows via analytical dashboards.
The resulting solution obtained by the customer is an effective tool for project management and project delivery. As such, it helps operators with collecting, collaborating on, and analyzing data. Its main functions include inventory management and service planning. The scope specified by the customer covered:
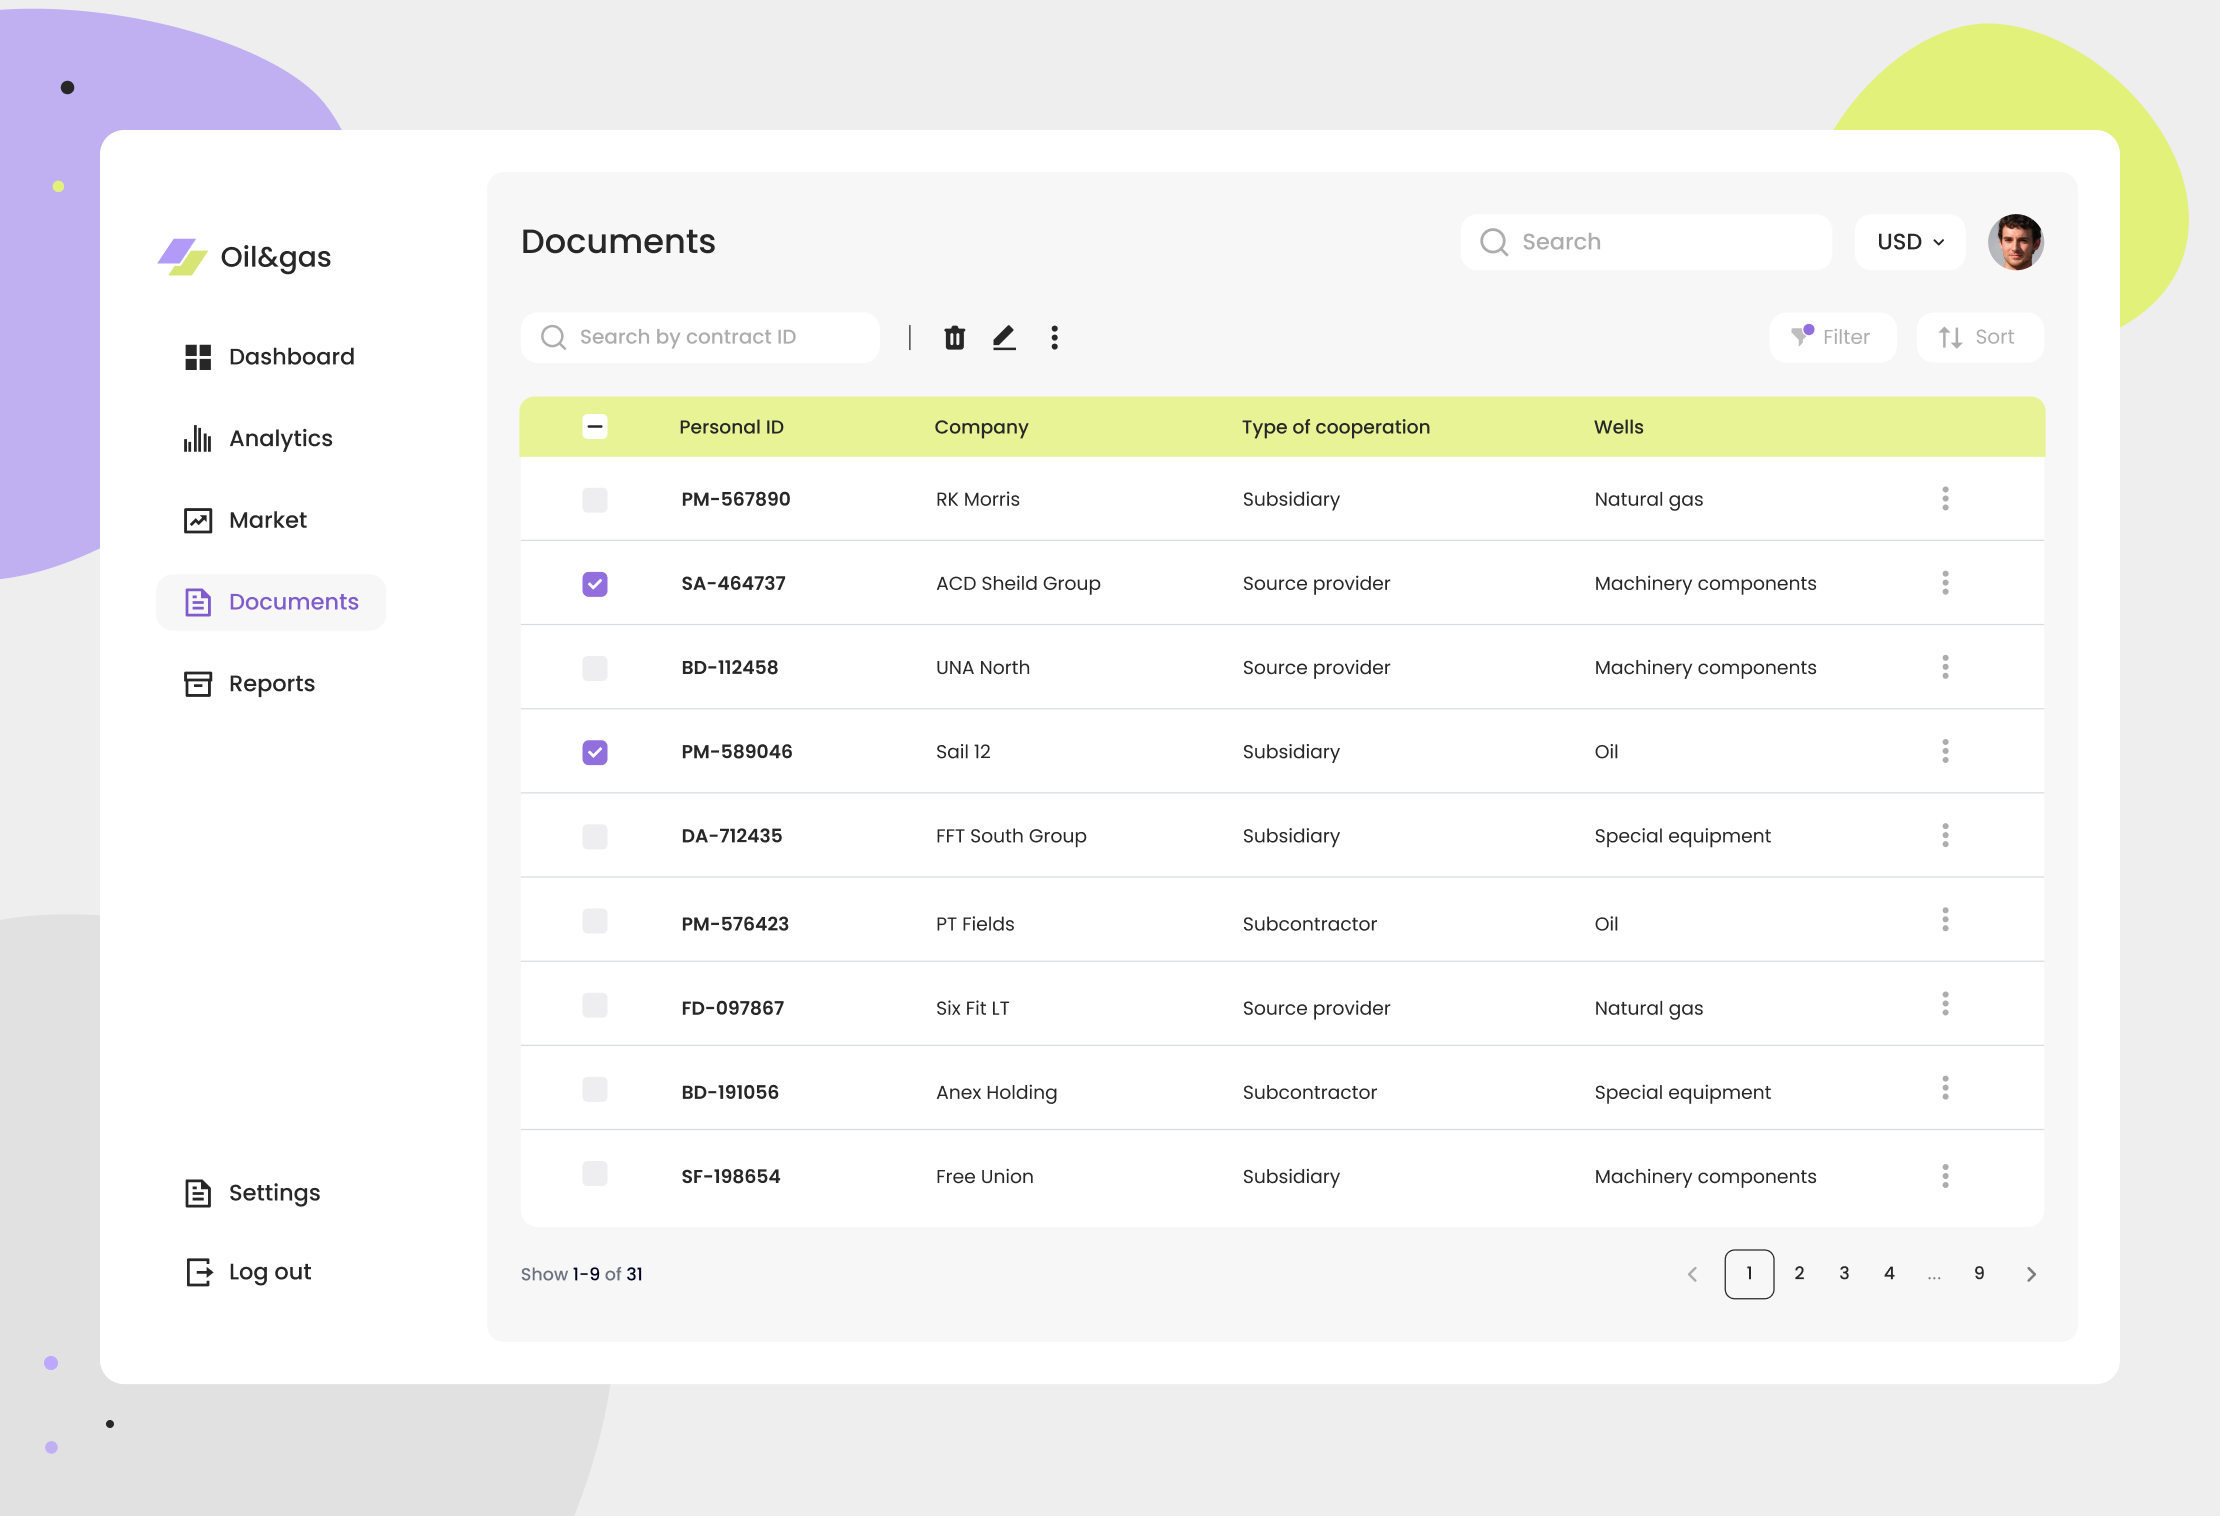
- Ensuring the cleanliness of digital data and control over operational procedures;
- Adding a feature to generate unique digital forms;
- Automating work processes and generalizing and displaying all form entries with pictures, with no manual data entry required.

Solution
After a thorough evaluation round, we were in the right position to present and offer a unique well monitoring solution specifically for the customer's business needs.
Andersen has helped to improve and accelerate the operations by allowing users to complete, clone, digitally sign, and share forms. Companies can now capture and track progress and issues on the go, commenting and uploading PDFs via a mobile and tablet app. Andersen's solution automatically collects all data from forms and actions, allowing users to unlock individual analytics and insights with a click or filter switch.
The continuous monitoring solution provides real-time production data, enabling data-driven business decisions.
App functionality
- At the user's request, the app connects to the customer's server and receives information about an oil well and its equipment status (e.g., rod or mechanism loading, alarms) via HTTP requests and responses;
- The tree view of the data allows users to easily find and access the necessary information. In order to score another point for usability, we designed an app that perfectly runs on a variety of mobile screens;
- The app uses artificial neural networks trained with sufficient data to distinguish oil reservoirs from the background in the images provided;
- For further analysis, the app uses neural networks augmented with filtering algorithms to scan the number of oil tanks detected and recognize numbers depicted on them;
- In order to determine oil levels in tanks, the appl uses computer vision algorithms to capture and process images of the inside visible part of each tank, its outside visible part, and the roof. The oil tanks are then segmented and classified by fluid level.

Project results
End-users now have a convenient app at their disposal. On average, each end client achieves the following results:
- 97% user satisfaction rate;
- 27% lower operational costs.
Let's talk about your IT needs
What happens next?
An expert contacts you after having analyzed your requirements;
If needed, we sign an NDA to ensure the highest privacy level;
We submit a comprehensive project proposal with estimates, timelines, CVs, etc.
Customers who trust us
